
Overview
The population of Bristol has become increasingly diverse, growing from a 5.1% minoritised population in 1991 to 18.9% in 2021 (see Graph 1) (Bristol City Council, 2023c). The largest percentage increase in the minoritised population has been the ‘Black African’ group from 2.8% in 2011 to 3.8% in 2021. The largest minority ethnic groups in 2021 were Somali (1.9%), Pakistani (1.9%) and Indian (1.8%) (Bristol City Council, 2023c). An analysis of the wards with the largest percentage of Black and Minoritised communities using the Census 2021 variables ‘Occupation’, ‘Highest level of qualification’ and ‘Economic activity status’ serves as an opportunity to analyse the socio economic status of minoritised communities, and create policy solutions in order to provide immediate support.

Graph 1: Change in ethnic groups in Bristol from 1991 - 2021 (Bristol City Council, 2023c)
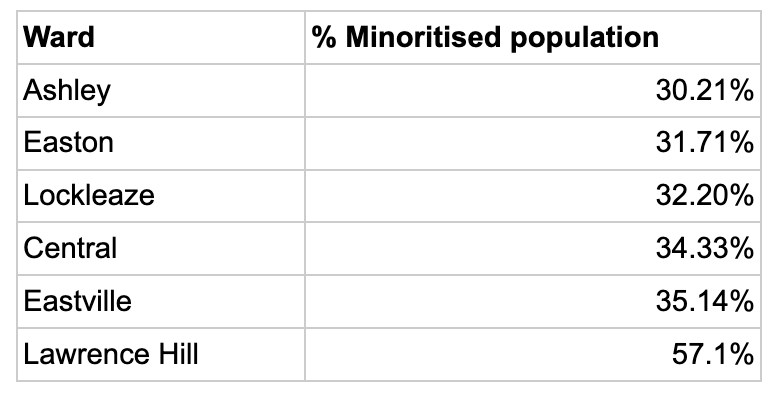
Table 1: Wards with highest percentage of minoritised communities (Bristol City Council, 2023a)
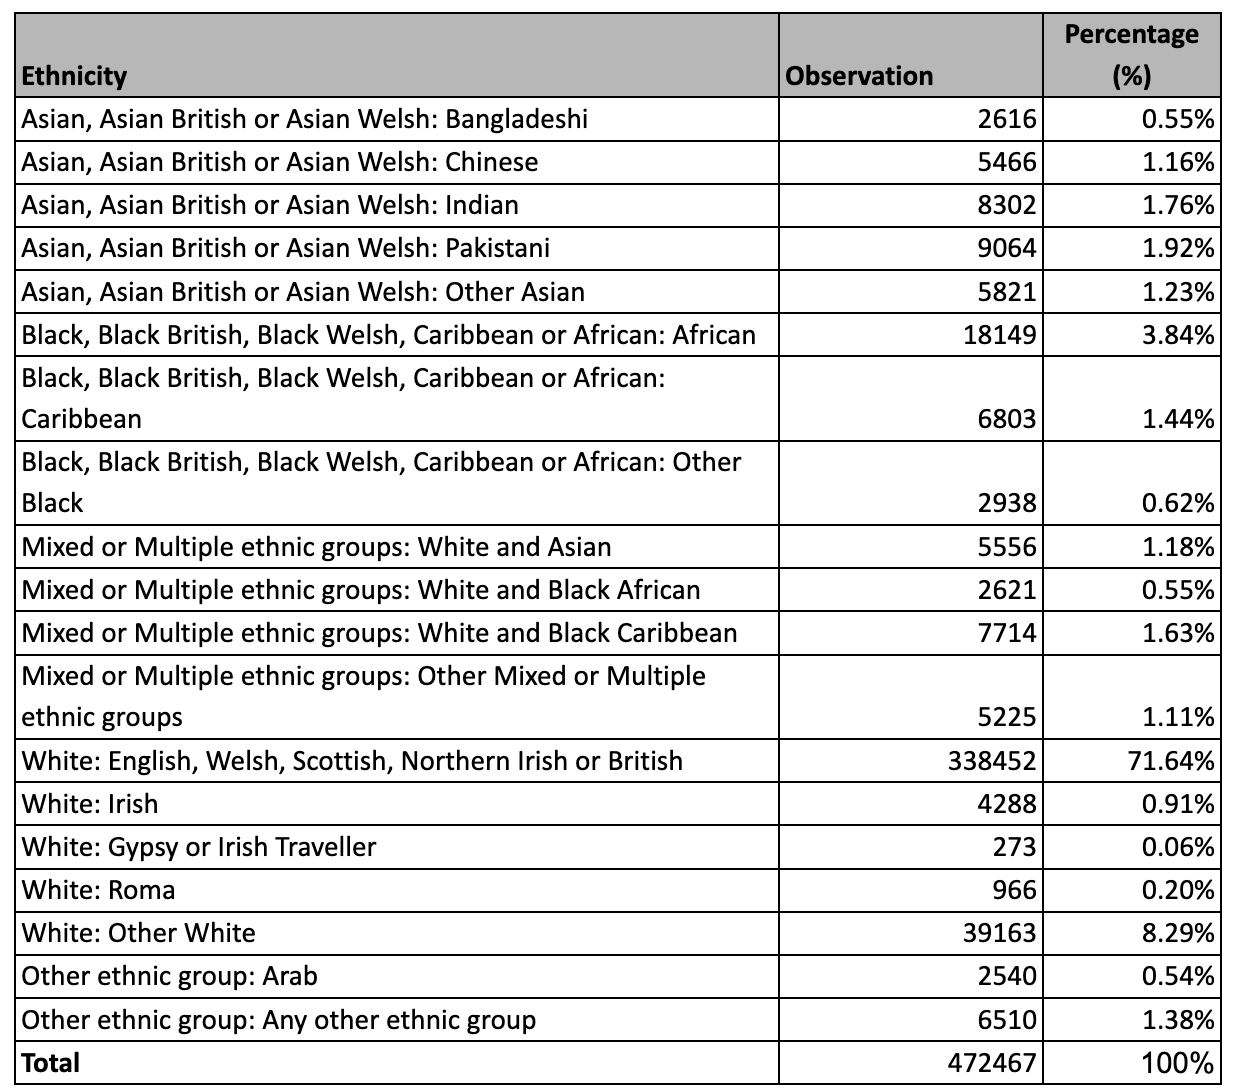
Table 2: Ethnic groups in Bristol from the 2021 Census (Bristol City Council, 2023b).
Labour Markets: Ashley, Easton, Lockleaze, Central, Eastville and Lawrence Hill
In Ashley:
White people are almost 26-times (25.7) more likely to occupy managers/directors/senior official roles (Office for National Statistics, 2023d).
Only an average of 4.06% of individuals who hold Level 4 qualifications are from minoritised backgrounds, compared to 68.86% of individuals who identify as White: English/Welsh/Scottish/Northern Irish/British (Office for National Statistics, 2023i).
36.43% of the population with no qualifications identify as Black, the highest in the ward followed by White: English/Welsh/Scottish/Northern Irish/British at 27.71% and Asian/Asian British/Asian Welsh at 17.15% (Office for National Statistics, 2023i).
In Easton:
The highest proportion of individuals who identify as Asian/Asian British/Asian Welsh are in Sales/Customer Service occupations (27.09%) (Office for National Statistics, 2023d).
The highest proportion of individuals who identify as Black/Black British/Black Welsh/Caribbean/African (24.96%) are in Elementary occupations (Office for National Statistics, 2023d).
Minoritised communities are represented more in Elementary, service and non-professional occupations, while White people are more likely to occupy Professional/Technical occupations and Managerial roles (Office for National Statistics, 2023d).
14.43% of the Economically active: Unemployed population identify as Asian/Asian British/Asian Welsh, twice the city average of 7% (Office for National Statistics, 2023e).
In Lockleaze, Central, Eastville and Lawrence Hill:
In Lockleaze, the highest proportion of individuals who identify as Mixed ethnic group have Associate Professional and Technical Occupations (Office for National Statistics, 2023d).
14.15% of those in Central in professional occupations identify as Asian, compared to 2.51% who identify as Black, 4.48% who identify as Mixed ethnic group and 4.09% who identify as Other ethnic group (Office for National Statistics, 2023d).
19.94% of those in caring/leisure occupations identify as Black, followed by elementary occupations (15.16%) compared to being 11% of the population in Eastville (Office for National Statistics, 2023d).

Graph 2: Occupation by ethnicity in Bristol (Office for National Statistics, 2023j).
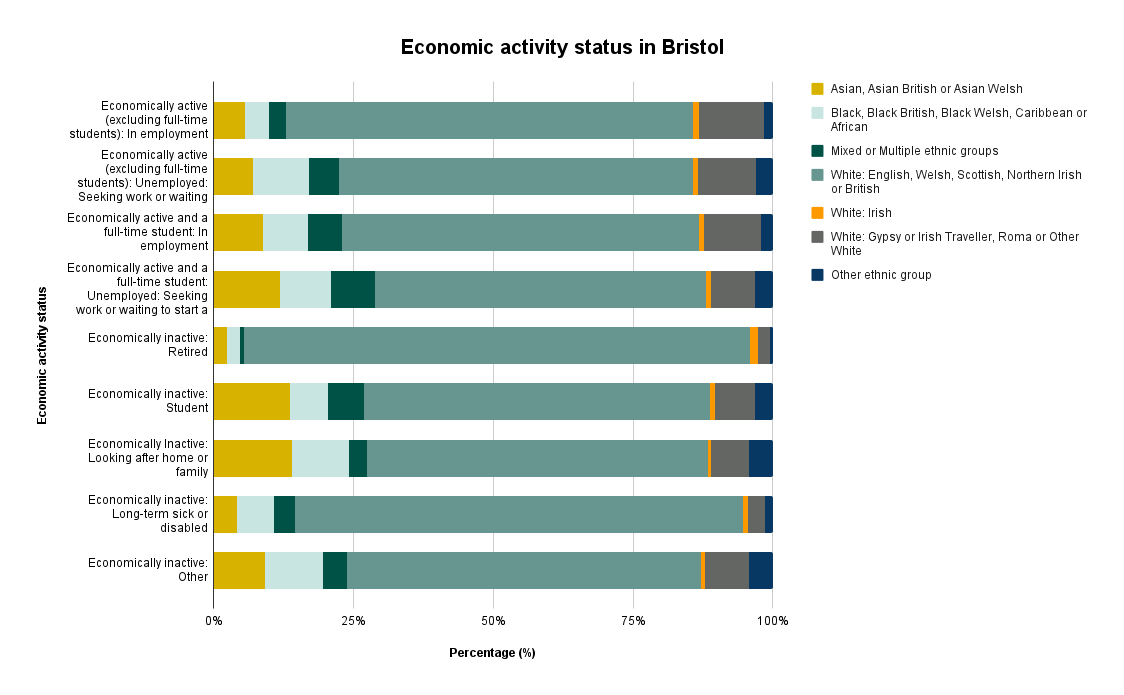
Graph 3: Economic activity status by ethnicity in Bristol (Office for National Statistics, 2023i).
Policy Implications
Across these wards, individuals from minoritised communities are more likely to work in caring/leisure/service, sales/customer service, process/plant/machine operatives and elementary occupations. For example, in Ashley, only 2.9% of managers/directors/senior officials identify as Black, compared to 26.92% of individuals in elementary occupations who identify as Black (Office for National Statistics, 2023d). Similarly, in Easton, 6.17% of individuals in Manager/directors/senior officials roles identify as Asian, compared to in sales/customer/service occupations with 27.09% of individuals identifying as Asian (Office for National Statistics, 2023d). This creates a wage disparity which proliferates in other areas of access to services and policy such as housing, health and education.
Cost-of- Living
The Cost-of-Living Crisis has resulted in the price of consumer goods and services rising at the fastest rate in four decades in the year from October 2021 - October 2022. In 2023 alone, in real terms (adjusted for inflation) growth in total pay fell by 1.2% and regular pay dropped by 0.8% over the same period (Office for National Statistics, 2023a).
A report by the Black South West Network (2023) entitled “Impact of the Cost-of-Living Crisis on Black and Minoritised Communities in Bristol'' found that 75% of respondents were struggling to afford basic items (groceries, cleaning supplies, basic hygiene products). Due to existing racial inequalities within the labour market, individuals from Black and minoritised communities are more likely to occupy service/operational occupations which are lower income. In Bristol, only 2.73% of those in the professional occupations identify as Black, compared to 10.66% in “caring, leisure and other service occupations”, where the highest percentage of individuals identify as Black.
Subsequently, the cost of living crisis which pervades healthcare, housing and social care will have a disproportionately negative impact on minoritised communities. Analysis by the New Economics Foundation (2022) has found that minoritised households are likely to expect an 8% increase in the cost of living, compared to White households who are likely to experience a 5% increase.
Housing, the Built Environment and Health
A Chartered Institute of Personnel and Development (2021) study found that 22% of minoritised respondents felt their career progression failed to meet their expectations because they had faced discrimination compared to 15% of White British respondents. Accordingly, the impact of the cost of living and stunted career progression leads to issues with housing due to the depleted social housing stock pushing many into an increasingly expensive private rental system, in turn delaying home ownership. In 2018, 48% of households in the South West in privately rented accommodation identified as ‘non-White’ (GOV.UK, 2021). Black and minoritised communities are overrepresented in the private rental sector, which has seen median rent increase by 25% from 2018-20, higher than the 6% growth in nominal wages over the same two-year period (Bristol City Council, 2023b).
With private rental prices increasing by up to 25% from 2018-20 (Bristol City Council, 2023b) and gentrification expanding to areas such as St Pauls and Easton, minoritised communities are at risk of potential displacement. Initiatives to improve the built environment such as the East Bristol Liveable Neighbourhood have been criticised by community organisations as being discriminatory towards disabled people, and those who rely on cars for their commute, many of which are from minoritised backgrounds (Edwards, 2023). Other initiatives to “modernise” the city such as the Temple Quarter Partnership regeneration project will disproportionately impact minoritised communities who are at risk of displacement and do not feel engaged in decisions made about their public spaces. A lack of access to career opportunities and the impact of the cost-of-living crisis has meant that individuals with minoritised backgrounds face more barriers towards home ownership, the most significant being the initial deposit, as most do not having savings or disposable income to set money aside on a monthly basis (Retief & Lodi, 2020).
Issues within housing can also lead to a deterioration of health. 60% of Bristol’s minoritised population live in the most disadvantaged wards (Retief & Lodi, 2020), while the 2019-20 English Housing Survey found that those from ethnic minority backgrounds have less positive perceptions of their area, particularly Black respondents (Department for Levelling Up, Housing and Communities, 2020). According to the 2020-21 English Housing Survey (Department for Levelling Up, Housing and Communities, 2022), the private sector has the highest proportion of older dwellings built before 1919, which are more likely to contain potentially fatal Category 1 Hazards such as mould and damp. In Ashley, Black people are overrepresented in the ‘Bad or very bad health’ category at 18.81% despite making up 14% of Ashley’s population, similar to Eastville where Asian people are overrepresented in the same category (Office for National Statistics, 2023g). In Easton, the proportion of Black and Asian people increases the worse they grade their health.
Education
The influence of ethnic disparities within the labour market are also represented in education statistics, particularly those on school absences. Bristol is:
2nd highest in the country for school absences by Asian children and young people at 5.9%.
3rd highest in the country for school absences by Black children and young people at 5.5%.
4th highest in the country for school absences by Mixed children and young people at 6.4%.
10th highest in the country for school absences by Other ethnic group children and young people at 5.7% (GOV.UK, 2023a).
High rates of school absence lead to a lack of participation in further education. Despite Black people being overrepresented in participation in further education statistics at 7% compared to the national population of 4.2%, White people are still almost 11 times (10.9) more likely to participate in further education (GOV.UK, 2023b).
Policy recommendations
In order to tackle the wage disparity between minoritised communities and their White counterparts:
Emphasis needs to be on developing pathways to high value skills (digital, creative, high value manufacturing, green, technology) within high value/high growth sectors particularly where underrepresentation exists. Tailored policy and decisionmaking can be implemented to increase accessibility where systemic barriers are hindering personal and professional development in Black and minoritised individuals.
The ability of Black and Minoritised wealth creators, entrepreneurs and social entrepreneurs to access finance to grow local economies and create skills and jobs opportunities that meet their needs will determine the economic sustainability of existing communities. There is great untapped innovative potential within our communities. However, those ideas currently lack the access to finance or social capital to turn them into reality. By nurturing future innovators and wealth creators by enabling the tools, advice and support needed to rapidly drive needed social and economic change would act as a core catalyst for delivering desired policymaking outcomes.
Create equitable solutions to public commissioning contracts. BSWN’s Make it Work programme achieved a £377,000 increase in economic benefit for the Black & Minoritised Adult Social Care Sector in Bristol. Removing barriers to procurement and challenging who has access to public funds serves to redistribute economic power to minoritised communities.
Conclusion
It is clear how ethnic disparities within the labour market are linked to other disparities in policy such as housing, and influenced by national crises such as the cost of living crisis. Issues within the labour market leads to wage disparity between minoritised communities and their White counterparts. As suggested in the policy recommendations, creating pathways to high value skills and increasing access to public and private funding opportunities will increase the economic power of minoritised communities. Focusing on local enterprise, inequitable approaches to procurement and increasing access to finance for local communities will improve the economic wellbeing of minoritised communities.
Bibliography
Black South West Network (2023) Impact of the Cost-of-Living Crisis on Black & Minoritised Communities in Bristol.
Bristol City Council (2023a) Bristol Census Data Profiles . Available at: https://app.powerbi.com/view?r=eyJrIjoiYjgwY2RkYmYtMGUxMC00NjkwLWI3YzUtMDY2YTNlMGE0YWY1IiwidCI6IjYzNzhhN2E1LTBmMjEtNDQ4Mi1hZWUwLTg5N2ViN2RlMzMxZiJ9.
Bristol City Council (2023b) Bristol Living Rent Commission. Available at: https://thebristolmayor.com/wp-content/uploads/2023/06/Bristol-Living-Rent-Commission-Full-Report.pdf.
Bristol City Council (2023c) Census 2021 Dashboard. Available at: https://app.powerbi.com/view?r=eyJrIjoiMGEyMjY3MWYtZGY5YS00NjY0LTg3NzYtMDA5ZGZlMjhiNzI2IiwidCI6IjYzNzhhN2E1LTBmMjEtNDQ4Mi1hZWUwLTg5N2ViN2RlMzMxZiJ9
Chartered Institute of Personnel and Development (2021) Ensuring equality of career progression opportunities. Available at: https://www.cipd.org/globalassets/media/knowledge/knowledge-hub/reports/2021-pdfs/2021-race-inclusion-report-3-career-opportunities-8106.pdf
Edwards, M. (2023) ‘“We want them to listen to us”: fear and anger in Somali community over liveable neighbourhood plans’, Bristol Cable , 28 June. Available at: https://thebristolcable.org/2023/06/we-want-them-to-listen-to-us-fear-and-anger-in-somali-community-over-liveable-neighbourhood/.
Ellis, S. (2023) ‘NHS dental care shortage: thousands to miss out across the west’, BBC News, 8 June. Available at:https://www.bbc.co.uk/news/uk-england-bristol-65833128.
Department for Levelling Up, Housing and Communities (2020) English Housing Survey, 2019 to 2020: well-being and neighbourhoods. Available at: https://assets.publishing.service.gov.uk/government/uploads/system/uploads/attachment_data/file/1000096/EHS_19-20_Well-being_neighbourhoods_report.pdf
Department for Levelling Up, Housing and Communities (2022). English Housing Survey: Headline Report, 2020-21.
GOV.UK (2023a) Absence from school, Ethnicity facts and figures. Available at: https://www.ethnicity-facts-figures.service.gov.uk/education-skills-and-training/absence-and-exclusions/absence-from-school/latest#:~:text=in%20the%202020%20to%202021%20school%20year%2C%20the%20overall%20absence,the%20highest%20overall%20absence%20rates.
GOV.UK (2023b) Further education participation, Ethnicity facts and figures. Available at: https://www.ethnicity-facts-figures.service.gov.uk/education-skills-and-training/a-levels-apprenticeships-further-education/further-education-participation/latest#by-ethnicity-compared-with-the-overall-population.
GOV.UK (2021) Renting from a private landlord, GOV.UK: Ethnicity Facts and Figures. Available at: https://www.ethnicity-facts-figures.service.gov.uk/housing/owning-and-renting/renting-from-a-private-landlord/latest.
New Economics Foundation (2022) Losing the Inflation Race: Poorly targeted policy is failing to prevent an income crisis. Available at: https://neweconomics.org/2022/05/losing-the-inflation-race (Accessed: 2022).
Office for National Statistics (2023a) Cost of living latest insights . Available at: https://www.ons.gov.uk/economy/inflationandpriceindices/articles/costofliving/latestinsights#:~:text=In%20the%20UK%2C%20the%20price,from%207.8%25%20in%20April%202023.
Office for National Statistics (2023b) Highest level of qualification variable: Census 2021, Office for National Statistics . Available at: https://www.ons.gov.uk/census/census2021dictionary/variablesbytopic/educationvariablescensus2021/highestlevelofqualification.
Office for National Statistics (2023c) Electoral wards and divisions, Highest level of qualification (7 categories) and Ethnic group (8 categories). Available at: https://api.beta.ons.gov.uk/v1/datasets/create/filter-outputs/2dc243d6-8416-4d7d-8764-ed9b738f3233.
Office for National Statistics (2023d) Electoral wards and divisions, Ethnic group (8 categories) and Occupation (current) (10 categories). Available at: https://api.beta.ons.gov.uk/v1/datasets/create/filter-outputs/e27f88db-5703-4c3f-98f0-b8064583f260.
Office for National Statistics (2023e) Electoral wards and divisions, Ethnic group (8 categories) and Economic activity status (7 categories). Available at: https://api.beta.ons.gov.uk/v1/datasets/create/filter-outputs/e9270245-af75-4847-82f3-4390627f0866.
Office for National Statistics (2023f) Electoral wards and divisions, Ethnic group (8 categories) and General health (4 categories). Available at: https://api.beta.ons.gov.uk/v1/datasets/create/filter-outputs/692188f7-42e4-49cd-b2bf-231fdf3fc3d0.
Office for National Statistics (2023g) Electoral wards and divisions and Ethnic group (8 categories). Available at: https://api.beta.ons.gov.uk/v1/datasets/create/filter-outputs/b79e8b59-5374-4f63-b311-fed8ced25cbc.
Office for National Statistics (2023h) Electoral wards and divisions, Ethnic group (8 categories) and General health (4 categories). Available at: https://api.beta.ons.gov.uk/v1/datasets/create/filter-outputs/692188f7-42e4-49cd-b2bf-231fdf3fc3d0.
Office for National Statistics (2023i) Upper tier local authorities, Highest level of qualification (7 categories) and Ethnic group (8 categories). Available at: https://api.beta.ons.gov.uk/v1/datasets/create/filter-outputs/aeae6b98-7f4d-44de-906c-68226fd28ea7.
Office for National Statistics (2023i) Upper tier local authorities, Economic activity status (current) (10 categories) and Ethnic group (8 categories). Available at: https://api.beta.ons.gov.uk/v1/datasets/create/filter-outputs/57a0270a-4ce7-452f-b243-0c105c3a630e.
Office for National Statistics (2023j) Upper tier local authorities, Occupation (current) (10 categories) and Ethnic group (8 categories). Available at: https://api.beta.ons.gov.uk/v1/datasets/create/filter-outputs/76105a78-168b-49e3-9698-a5437ab59831.
Retief, A., Lodi, C. (2020) Housing BAME Communities in Bristol: A Community-Led Initiative. Bristol: Black South West Network.
Glossary (Office for National Statistics, 2023a)
Highest level of qualification
Level 1 and entry level qualifications: 1 to 4 GCSEs grade A* to C, Any GCSEs at other grades, O levels or CSEs (any grades), 1 AS level, NVQ level 1, Foundation GNVQ, Basic or Essential Skills
Written by Morayo Omogbenigun, Project Officer and edited by Angelique Retief, Senior Policy Officer BSWN.